Understanding Your Mortgage Amortization Schedule
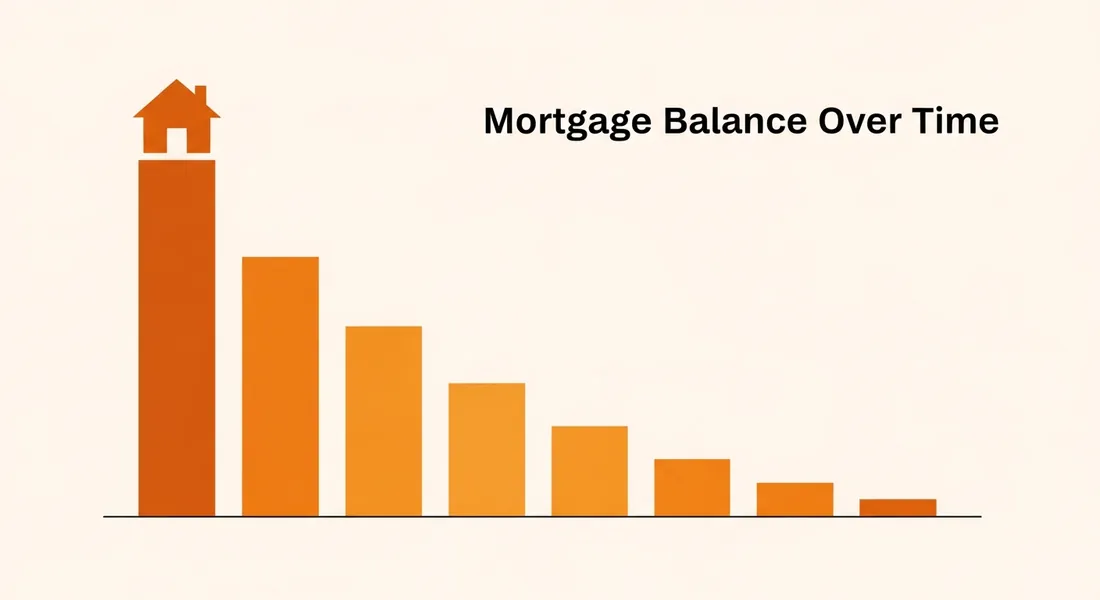
Table of Contents
- What Is an Amortization Schedule?
- How Amortization Works
- Sample Amortization Table
- Why Early Payments Are Mostly Interest
- The Tipping Point: When Principal Exceeds Interest
- How Extra Payments Change the Schedule
- How to Read Your Schedule
- Amortization: 15-Year vs 30-Year
- Using Amortization to Your Advantage
What Is an Amortization Schedule?
An amortization schedule is a complete table showing every single payment you'll make over the life of your mortgage. Each row breaks down how much of your payment goes toward principal (reducing your loan balance) and how much goes toward interest (the cost of borrowing).
For a 30-year mortgage, your amortization schedule will have 360 rows — one for each monthly payment. It's essentially the roadmap of your entire loan, showing you the exact path from your first payment to your final one. The CFPB explains that understanding amortization is key to making smart decisions about your mortgage.
Think of an amortization schedule as the X-ray of your mortgage. On the surface, you see one consistent monthly payment. But underneath, the composition of that payment shifts dramatically over time — and understanding that shift can save you tens of thousands of dollars.
How Amortization Works
Here's the fundamental concept: your monthly payment stays the same throughout the loan, but the split between principal and interest changes with every payment. In the early years, the lion's share goes to interest. As you gradually pay down the balance, more and more of each payment shifts toward principal.
Consider a $320,000 loan at 6.75% for 30 years. Your fixed monthly payment for principal and interest is $2,075. Here's how the split changes:
- Payment #1: $1,800 interest + $275 principal (87% to interest)
- Payment #60 (year 5): $1,703 interest + $372 principal (82% to interest)
- Payment #180 (year 15): $1,196 interest + $879 principal (58% to interest)
- Payment #300 (year 25): $477 interest + $1,598 principal (23% to interest)
- Payment #360 (final): $12 interest + $2,063 principal (0.6% to interest)
The transformation is remarkable. Your first payment sends 87 cents of every dollar to the bank as interest. Your last payment sends less than a penny per dollar to interest. Everything in between is a gradual slide from one extreme to the other.
Sample Amortization Table
Here's a simplified year-by-year view for our $320,000 loan at 6.75%:
| Year | Annual Interest | Annual Principal | Remaining Balance | Equity Built |
|---|---|---|---|---|
| 1 | $21,413 | $3,487 | $316,513 | $3,487 |
| 5 | $20,370 | $4,530 | $300,117 | $19,883 |
| 10 | $18,598 | $6,302 | $274,093 | $45,907 |
| 15 | $15,852 | $9,048 | $236,428 | $83,572 |
| 20 | $11,686 | $13,214 | $181,671 | $138,329 |
| 25 | $5,307 | $19,593 | $101,730 | $218,270 |
| 30 | $167 | $24,733 | $0 | $320,000 |
Notice how in year 1, you pay $21,413 in interest but only reduce your balance by $3,487. By year 25, those numbers have flipped dramatically. Over the full 30 years, you'll pay approximately $427,000 in total — meaning about $107,000 is pure interest on top of your original $320,000 loan.
Why Early Payments Are Mostly Interest
This is the part that shocks most homeowners. On your very first payment, roughly 87% goes to interest and only 13% to principal. It feels like you're barely making a dent in your loan balance — because you aren't.
The reason is simple math: interest is calculated on the outstanding balance. When you owe $320,000, one month of interest at 6.75% is $1,800. As that balance drops, less interest accrues, and more of your fixed payment goes to principal. It's a snowball effect that accelerates over time.
This is also why the first few years of homeownership are the most expensive in terms of interest. If you're planning to sell within 5 years, understand that you'll have built relatively little equity through payments alone. After 5 years of payments on our $320,000 example, you've paid $124,500 total but only reduced your loan by about $19,883. The other $104,617 went straight to interest.
The Real Cost of "Starting Over"
This front-loaded interest structure is why refinancing decisions matter so much. If you refinance into a new 30-year loan after 10 years, you restart the amortization clock. You go back to paying 80%+ interest on each payment, even though you had finally reached a 60/40 split. This is one of the most common — and costly — mistakes homeowners make. Our refinance calculator guide helps you evaluate whether a refinance truly saves you money after accounting for the reset.
The Tipping Point: When Principal Exceeds Interest
One of the most satisfying milestones in your mortgage journey is the "tipping point" — the month when your principal payment first exceeds your interest payment. After this point, more than half of every payment builds your equity.
For our $320,000 loan at 6.75%, the tipping point occurs around payment #252 (year 21). That's right — for the first 21 years, the majority of every payment goes to the bank as interest. Only in the final 9 years does principal take the lead.
At different rates, the tipping point changes:
- 5.0% rate: Tipping point at year 17
- 6.0% rate: Tipping point at year 19
- 6.75% rate: Tipping point at year 21
- 7.5% rate: Tipping point at year 23
With a 15-year loan, the tipping point comes much sooner — typically around year 5–7 — because the higher payments attack principal more aggressively from the start.
How Extra Payments Change the Schedule
One of the most powerful things about understanding your amortization schedule is seeing the impact of extra payments. When you make an extra payment, 100% of that extra amount goes directly to principal — none to interest.
Using our $320,000 example, here's what happens with extra payments:
- Extra $200/month: Pay off your loan in 23.5 years instead of 30. Save approximately $68,400 in interest. Tipping point moves to year 15.
- Extra $500/month: Pay off in 19 years. Save approximately $121,500 in interest. Tipping point moves to year 10.
- One extra payment per year: Pay off in about 25.5 years. Save roughly $53,000 in interest.
The earlier you start making extra payments, the greater the impact because you're reducing the balance that interest is calculated on. A $5,000 extra payment in year 1 saves roughly $16,000 in interest. The same $5,000 payment in year 20 saves only about $4,000. For a complete breakdown, check our guide on how extra payments save you thousands.
How to Read Your Schedule
When you look at an amortization schedule, focus on these key columns:
- Payment number/date: When each payment is due
- Payment amount: Your total monthly P&I (stays constant for fixed-rate loans)
- Principal portion: How much reduces your balance (increases over time)
- Interest portion: The cost of borrowing (decreases over time)
- Remaining balance: What you still owe after each payment
Many homeowners check their amortization schedule yearly to track their progress. It can be motivating to see your remaining balance drop below certain milestones, and it helps you plan when you'll reach 20% equity (important for removing PMI).
Key Milestones to Watch For
Mark these moments in your amortization schedule:
- 20% equity (80% LTV): You can request PMI removal, saving $150–$300/month
- The tipping point: When principal exceeds interest in each payment — a psychological win
- 50% paid off: You owe less than half the original loan. On a $320,000 loan, this happens around year 22 with regular payments
- Final year: Your last 12 payments are almost entirely principal, with minimal interest
Amortization: 15-Year vs 30-Year
The amortization structure differs dramatically between a 15-year and 30-year mortgage. On a $320,000 loan:
- 30-year at 6.75%: Payment $2,075. Year 1 interest: $21,413. Total interest: $427,000. Principal exceeds interest at year 21.
- 15-year at 6.0%: Payment $2,699. Year 1 interest: $18,960. Total interest: $165,820. Principal exceeds interest at year 6.
The 15-year loan pays down principal nearly 3x faster from day one. After 5 years, you've built $56,000 in equity with the 15-year vs just $19,883 with the 30-year. For a comprehensive comparison, see our 15-year vs 30-year mortgage guide.
Using Amortization to Your Advantage
Here are practical ways to use your amortization knowledge:
- Time your extra payments early: An extra $5,000 payment in year 2 saves far more interest than the same payment in year 20. Front-load your extra payments for maximum impact.
- Plan for refinancing: If rates drop significantly, your amortization schedule shows exactly how much principal you've paid, helping you calculate whether refinancing makes sense. See our refinance calculator guide.
- Track equity building: Your remaining balance compared to your home's current value tells you your equity position — useful for home equity loans, PMI removal, or sale planning.
- Set payoff goals: Pick a target year for paying off your mortgage and calculate the extra monthly payment needed to reach it. Want to pay off a 30-year loan in 20 years? On our $320,000 example, you'd need about $500/month extra.
- Evaluate selling timing: If you're thinking about selling in a few years, your amortization schedule tells you exactly how much equity you'll have from payments alone. Add estimated appreciation for the full picture.
Your amortization schedule isn't just a table of numbers — it's a financial planning tool. The more you understand it, the more control you have over your mortgage and your wealth-building journey. Review it at least once a year, especially if you're considering making extra payments or refinancing. Understanding the mortgage payment formula behind these numbers gives you even more insight.
What Happens to Your Amortization When You Refinance
Refinancing resets your amortization schedule, and understanding this reset is critical for making a smart decision. Let's say you're 10 years into a $320,000 loan at 6.75%. You've paid down the balance to about $274,000 and you've finally reached a roughly 58/42 interest-to-principal split. You refinance into a new 30-year loan at 5.75%.
Your new payment drops from $2,075 to $1,598 — a $477/month savings that feels fantastic. But here's the hidden cost: your new amortization schedule starts over from scratch. Your first payment on the new loan splits about $1,313 to interest and $285 to principal — back to an 82/18 split. You've erased a decade of progress toward the tipping point.
Over the new 30-year term, you'll pay approximately $301,280 in total interest. Had you kept the original loan for the remaining 20 years, you'd have paid about $224,000 in interest. The refinance "saves" you $477/month but costs an extra $77,280 in total interest — plus you've added 10 years to your payoff date.
The smarter approach? Refinance into a 20-year term instead. At 5.75% for 20 years on $274,000, your payment would be approximately $1,938 — still $137/month less than your current payment — and you'd pay about $191,120 in total interest. That saves you $33,000 compared to keeping the original loan, without extending your timeline. This is why matching your remaining term matters enormously. For detailed guidance, see our refinance calculator guide.
Amortization and Your Tax Deduction
If you itemize deductions on your taxes, mortgage interest is deductible (up to $750,000 in loan value for mortgages originated after December 15, 2017). Your amortization schedule tells you exactly how much interest you paid each year — which is the number you'll report on Schedule A.
In the early years when interest is highest, the deduction is most valuable. On our $320,000 example, year-one interest of $21,413 could save you $5,353 in taxes if you're in the 25% bracket. By year 20, when annual interest drops to about $11,686, the tax savings shrink to $2,921. This declining benefit is another reason some homeowners choose to make extra payments in later years rather than early ones — though the interest savings from early extra payments almost always outweigh the tax benefit of keeping the interest. The IRS Publication 936 covers mortgage interest deduction rules in detail.
Understanding your amortization schedule transforms you from a passive borrower into an active financial strategist. Whether you're deciding to make extra payments, evaluating a refinance, timing a sale, or planning for PMI removal, the amortization table gives you the data to make confident, informed decisions. Use our complete mortgage calculator guide to run your own scenarios and see exactly how your payments break down over time.
Trusted by thousands of homeowners, realtors, and mortgage professionals.
Mortgage Pal is the #1 rated mortgage calculator app on the App Store. It's 100% free to use. Download today and try for yourself.
⭐ 4.8/5.0 • 3,300+ Reviews • 100% Free